The delivery risk your reporting misses.
One explainable measure that surfaces the work draining your teams without ever reaching a ticket. Built on Atlassian Forge, scored against your own organisation's baseline.
The work that doesn't reach a ticket is the work that breaks delivery.
Mentoring juniors. Reviewing pull requests. Answering questions in Slack. Fixing bugs before they become bugs. Real effort that drains capacity, skews estimates, burns people out, and never shows up in Jira.
Velocity becomes a lie
When invisible work absorbs the shocks, the same team commits to wildly different amounts each sprint. Planning becomes guesswork.
Risk arrives late
Burndown charts show you the slip after it's happened. The leading indicators are buried in the patterns your dashboards aren't watching.
People burn out quietly
Teams overstretched by work that doesn't count don't raise hands. They just become unreliable estimators, until they leave.
A short walkthrough.
From the team grid to a single indicator, the full product in under two minutes.
Pattern detection, not another dashboard.
IWRI doesn't add new data collection. It reads what's already in your Jira.
Read eight sprints
Analyses your last eight completed sprints across eligible Scrum projects. Read-only. No writes, no exports.
Measure indicators
Computes a set of transparent behavioural indicators, each tied to a specific, observable pattern.
Score against you
Population-relative scoring. Each team is measured against your own organisation's baseline, not an industry benchmark.
Surface a tier
Returns a risk tier from Healthy to High Risk, with the specific indicators driving it and the z-scores to explain why.
Five views. One signal.
From a single glance across every team, to the exact pattern driving a flag, to the shape of how those patterns co-occur across your org.
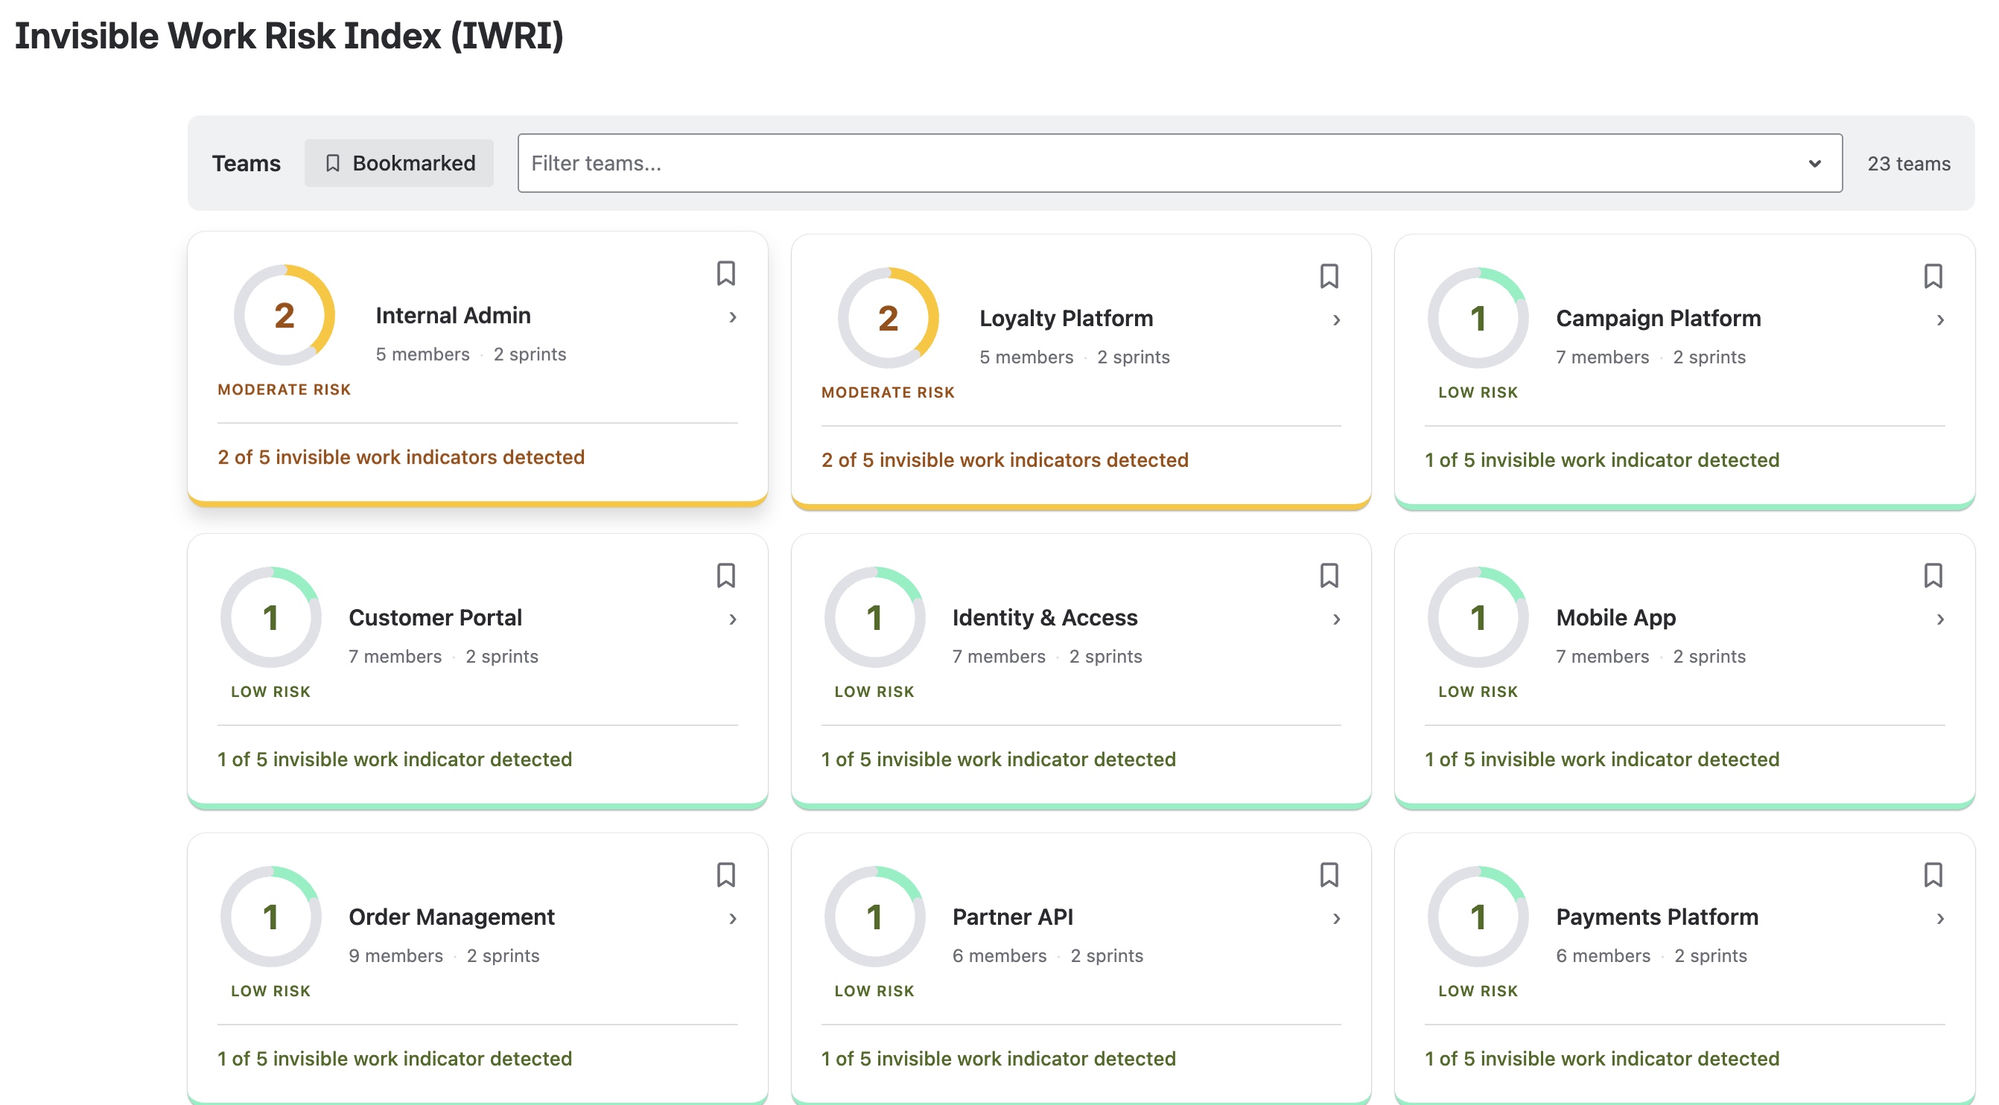
Every Scrum team, ranked at a glance.
Each card shows the team's risk tier, the number of indicators currently firing, and the size of the team. Bookmark the ones you watch most closely.
- Filter or search across hundreds of teams
- Sort by risk, by team size, or by sprint count
- Drill into any team with a single click
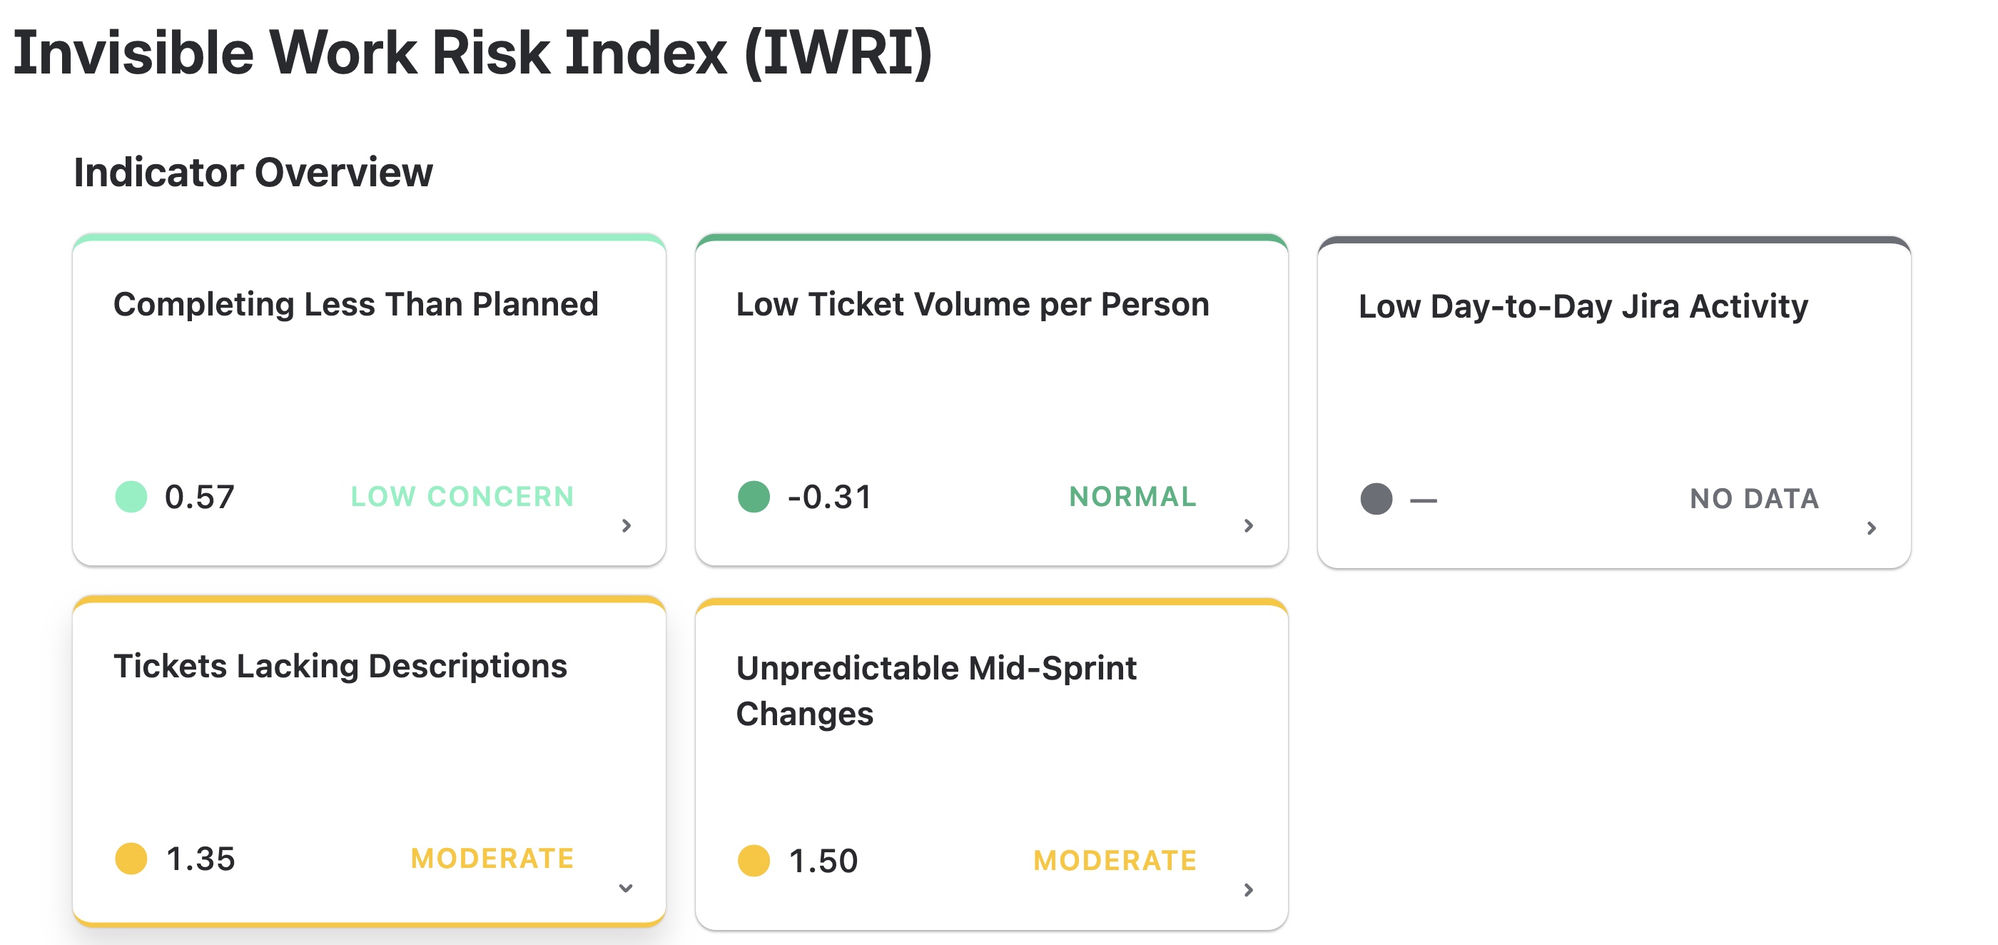
Five indicators, one screen, no mystery.
For every team you see all five indicators side by side, each labelled Normal, Low concern, Moderate, or High. Nothing is rolled into a single opaque score.
- Population-relative z-scores, not industry benchmarks
- "No data" is shown honestly, never assumed
- Severity colour reflects the same scale across teams
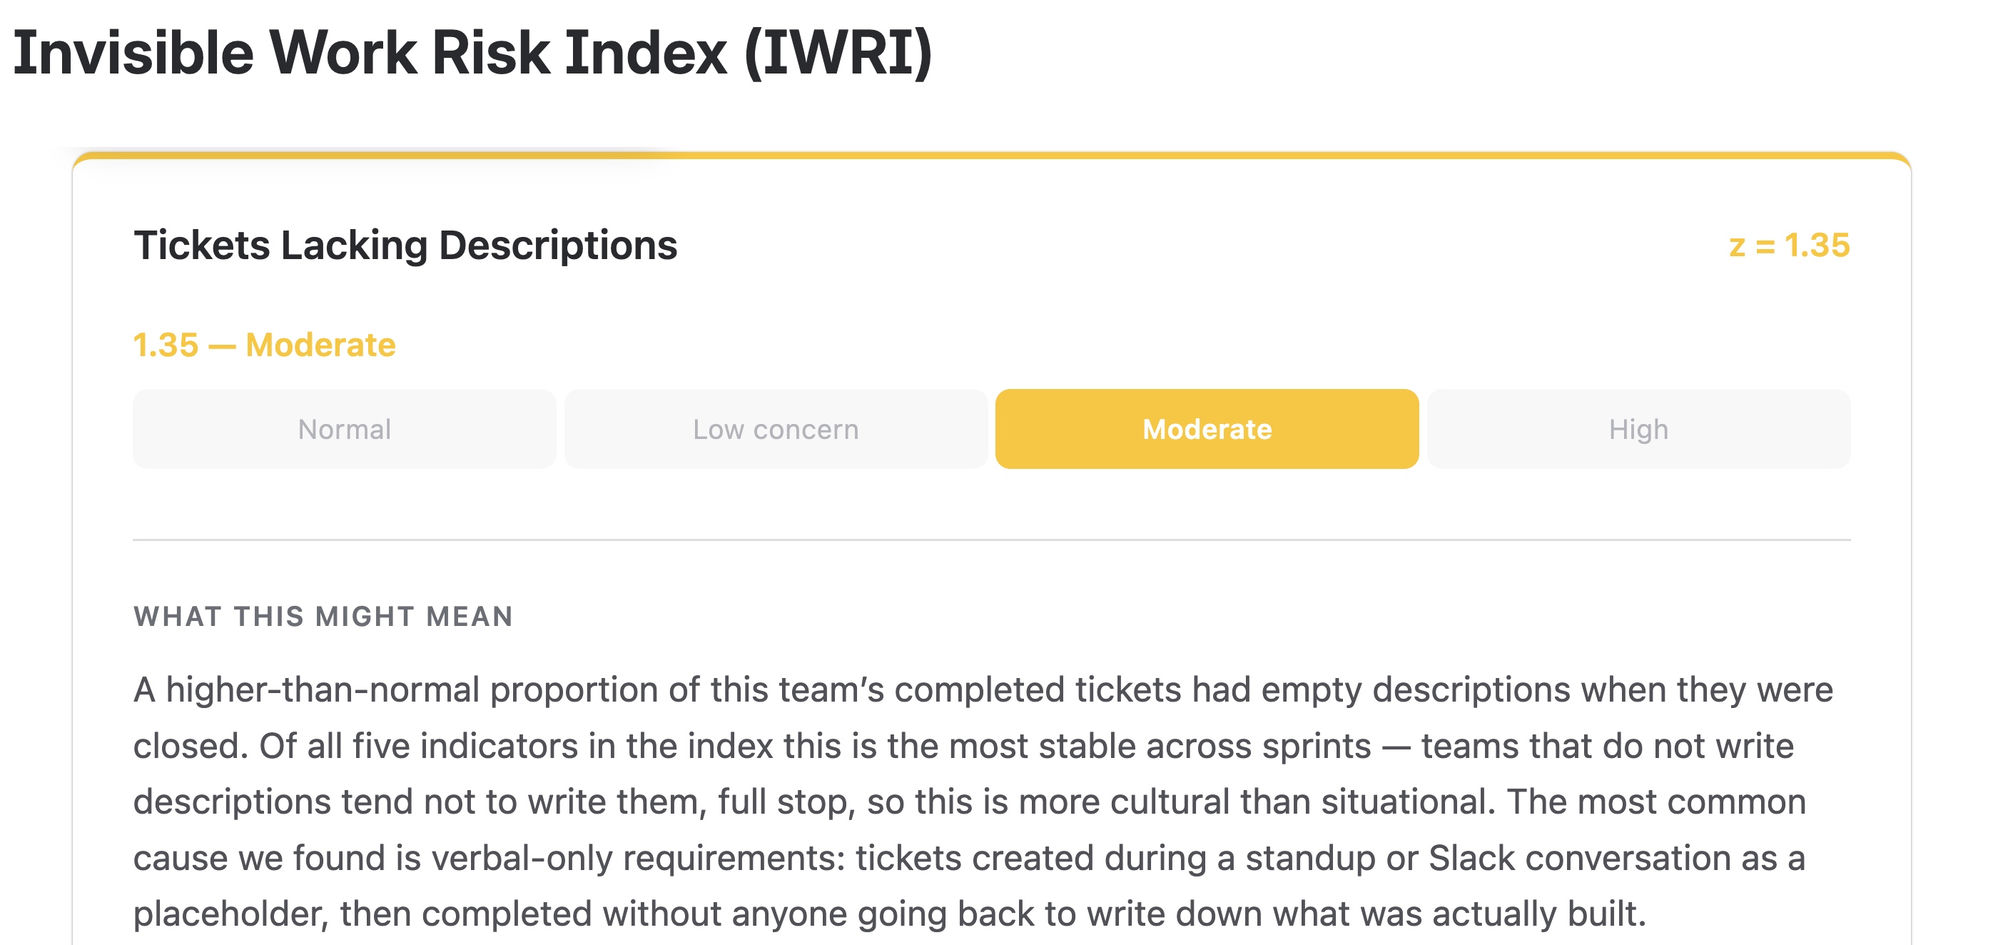
Every flag, explained in plain English.
Open any indicator to see its z-score, where it sits on the severity scale, and a "What this might mean" explanation written for humans, not auditors. No black boxes.
- Each indicator maps to a discrete, observable behaviour
- Plain-language causes and common alternative explanations
- Severity bands are documented in the public methodology
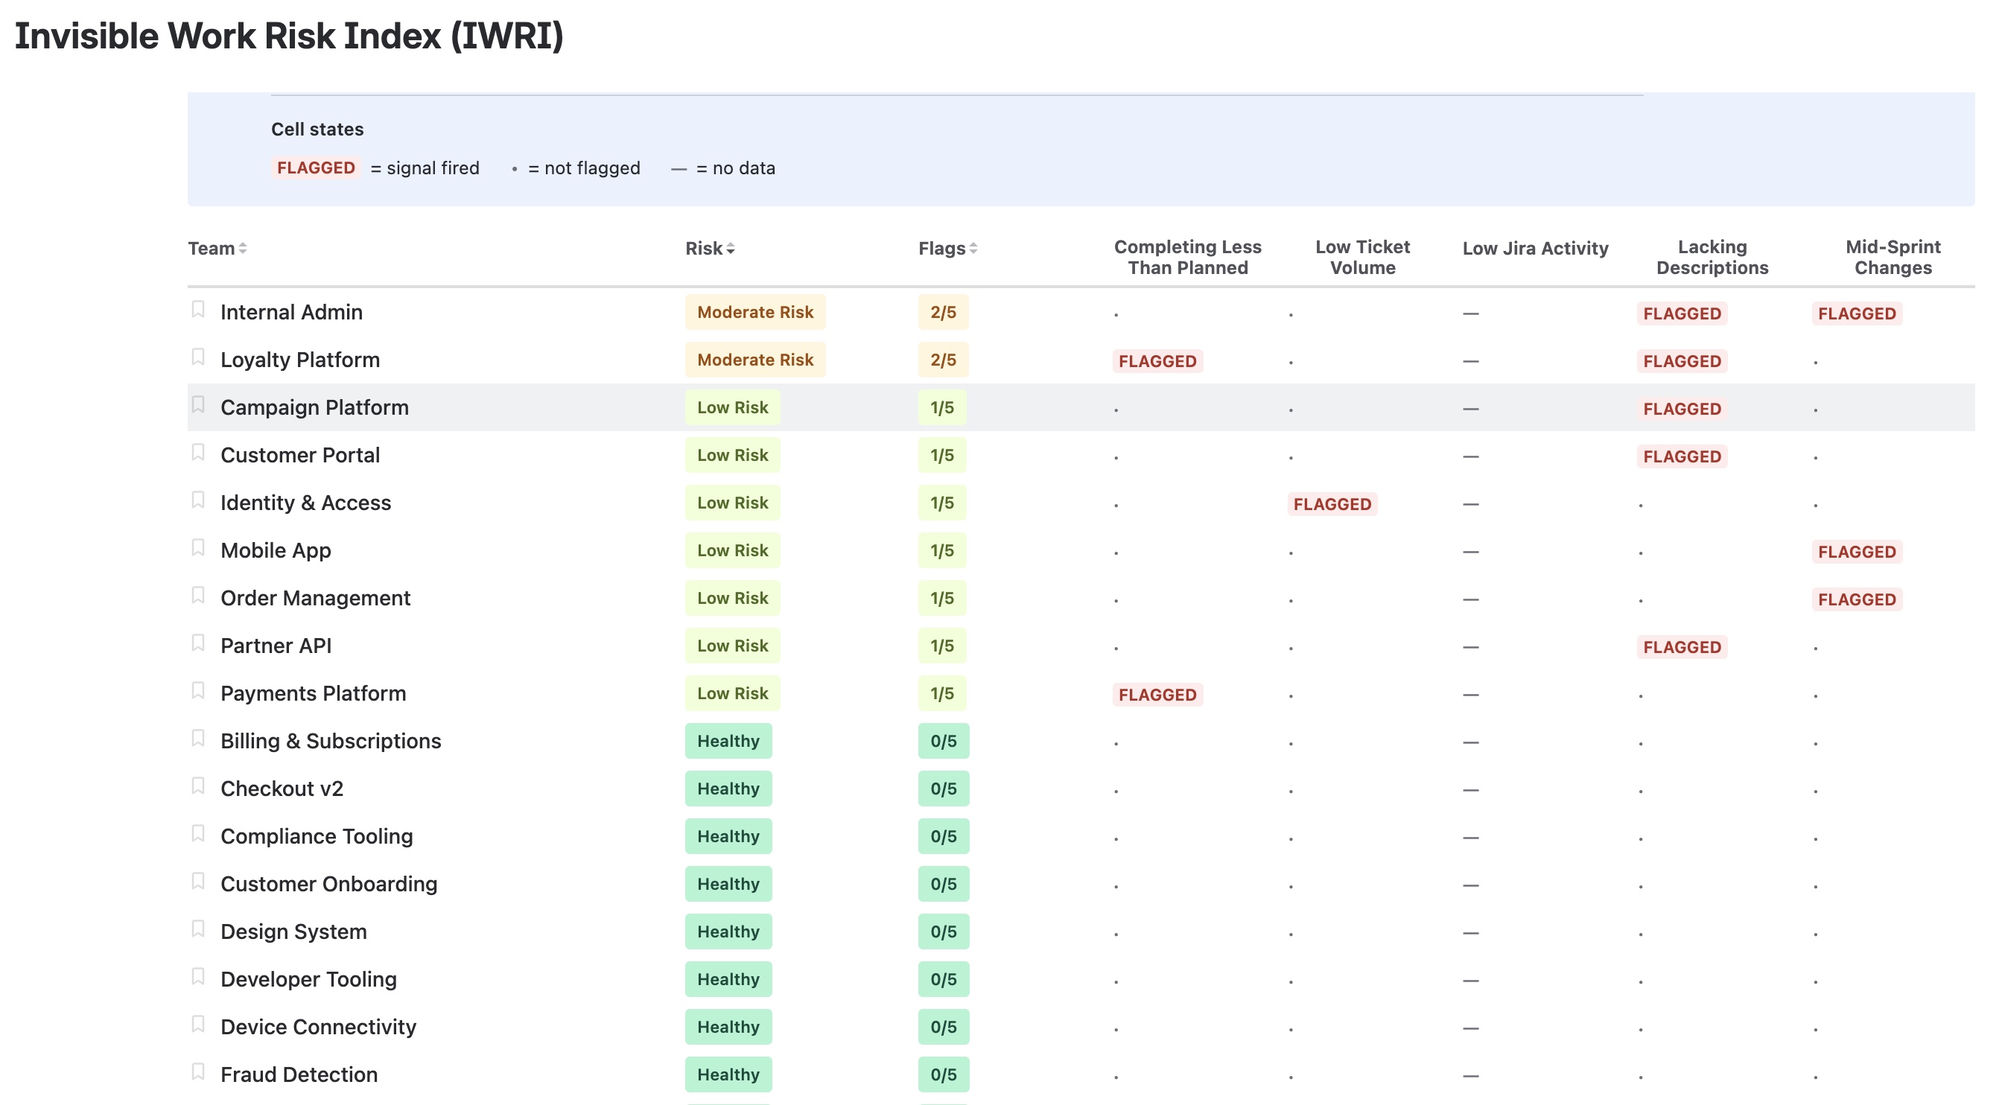
Every team, every flag, in one sortable table.
Step back from the card view and see your entire org at once. Sort by risk tier or flag count, and scan which indicators are firing across which teams.
- Sortable columns for risk, flag count, and each indicator
- Clear cell states: FLAGGED, dot, or no data
- Bookmark teams to keep them at the top
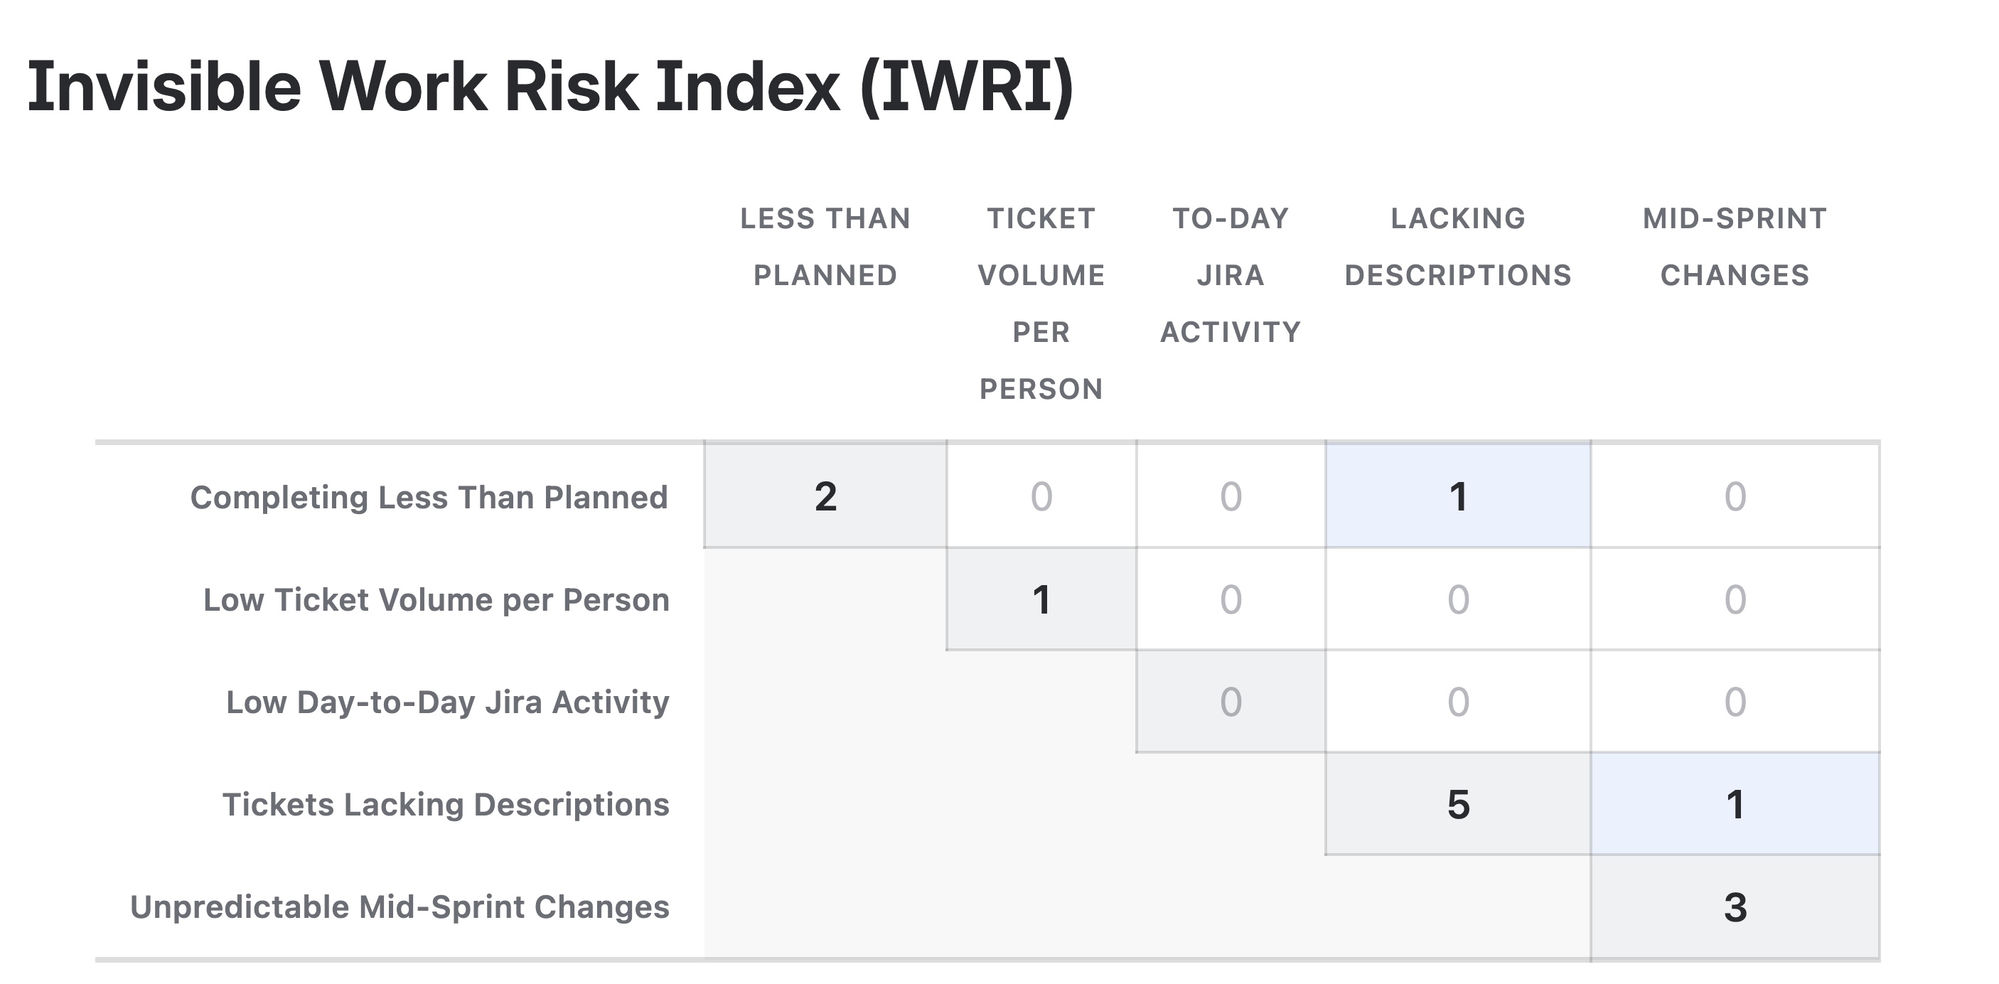
See which signals fire together.
Step further back. The co-occurrence matrix counts, across all your teams, how often each pair of indicators trips at the same time. Patterns at this level often tell you more than any single team.
- Spot organisation-wide failure modes, not just team-level ones
- Find which indicators reinforce each other in your org
- Guide where to invest in process, tooling, or training
Five transparent signals.
Each indicator is a discrete, observable behaviour, not a black-box score. If a flag fires, you can see exactly why.
Five risk tiers. One clear signal.
Indicators combine into a single tier per project. Each tier links back to the specific flags that drove it.
Not a surveillance tool.
IWRI surfaces patterns at the project and team level. It's a screening signal for healthy conversations, not a verdict on individuals. Our terms explicitly forbid using IWRI scores as the basis for performance management or any adverse employment decision.
Requires real signal.
To compute reliable statistics, IWRI needs a minimum of 20 eligible Scrum projects on your Jira Cloud site. Each project must have a few active assignees, recent sprints, and standard Scrum board configuration. See eligibility criteria →
Your data never leaves Atlassian.
IWRI runs entirely inside Atlassian's cloud, with no external network calls. We never see your issues.
Read-only across all Jira data
IWRI cannot create, modify, or delete any entity in your Jira instance.
No external network calls
All processing happens inside your Atlassian tenancy. No third-party endpoints.
Aggregates only, no PII
We store risk scores and configuration, never raw issue content or personal data.
Everything you'd want to read before installing.
See what your sprints already know.
Free for the first ten users on your site. Thirty-day trial above that. Install in a Forge click. No setup, no external account.